

Now more than ever companies are interested in agile team health checks, employee engagement, and exploring ways of measuring and visualizing how their teams are doing (KPI’s; ROV’s, NPS, etc.,)
The general idea being ya can’t improve what ya don’t measure. And without some sort of systemic approach with clear visualization – things would very much be a guessing game.
Many of the “traditional” performance metrics are all lagging indicators. By the time things have gone off the rails, the damage has been done. On the other hand, health, engagement and well-being are leading indicators. I like to think of them in terms of well-visits to the doctor’s office.
Two questions often come up when discussing team health, engagement, and morale:
- What are things I can do to impact team health (positively)?
- Can I really measure team health, engagement and morale?
The Bad News About Team Engagement, Health & Happiness Checks
Without some magic pixie dust, you just can’t make someone happy. And perhaps that shouldn’t even be a goal.
I was talking with Dave Snowden a while back (here’s a link to the podcast) – and he said something that struck a chord.
“We’re trying to create systems which learn, and ‘happy’ systems don’t learn, they’re complacent.”
Corporate Rebels apparently agree; see Screw Happiness At Work
Perhaps at times, we need to introduce (controlled) stressors into our systems with the intention of positive outcomes…like innovation, mutations, and disruptions.
So maybe a better question related to agile team health checks would be: “Do our systems nurture conditions that are conducive to healthy resilience and sustainable levels of engagement in our people and teams?”
These conditions can be things like practices, resources, and environments that build the capacity to adapt to stress healthfully – with positivity, focus, flexibility, organization, and proactivity.
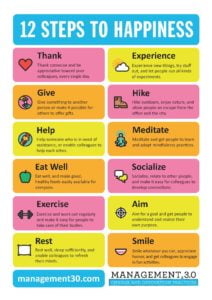
Management 3.0 provides a great place to start, with 12 things you can explore. (Just drop the focus on “Happiness”)
The Good News about Agile Team Engagement, Health and Happiness Checks
You can experiment with any or all of those 12 steps and monitor the results.

Following is a summary listing of many of the great models and tools available to measure and visualize your teams’ health and morale,
Use a combination to gain feedback on your experiments and show areas where there are opportunities for ongoing improvement.
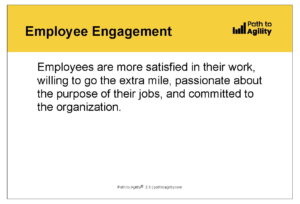
Best of all, by shining a light on employee engagement – the outcome where employees are more satisfied in their work, willing to go the extra mile, passionate about the purpose of their jobs, and committed to your organization – you’ll get measurable improvements in a whole slew of other key business outcomes!
Does our system nurture conditions that are conducive to healthy resilience in our people and teams? Share on X

How to Measure Agile Team Health, Employee Engagement and Overall Morale
It’s long been understood that survey instruments are imperfect measurements of mood and emotions. However, they nonetheless provide insights into people’s preferences, fears, and priorities. Following are some models to explore and experiment with. They can help you find out what your employees and teammates like, as well as lack, to work through today’s challenges.
Since all models are wrong the scientist must be alert to what is importantly wrong. It is inappropriate to be concerned about mice when there are tigers abroad. George Box Share on XPerceptyx
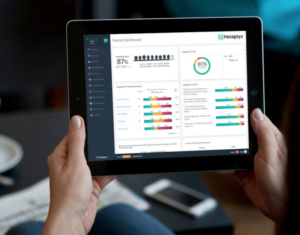
Perceptyx provides an enterprise-strength platform with employee survey results tied to the complete organizational hierarchy of your company.
Their tools combine feedback from multiple surveys such as onboarding, exit, pulse, or always-on, to see employee perceptions throughout the lifecycle of the employee experience.
Their approach allows one to connect the dots between the employee experience and business outcomes.
Spotify Agile Team Health Check
Spotify (Henrik Kniberg & Kristian Lindwall, Sep 2014) created their health check that looks at approx 10 areas of inquiry, each with three possible “ratings,” and columns for each squad aka Product Team.
Ratings
For each area of inquiry, each team is asked to rank where they are and what the trend is (stable, improving, or getting worse.) Color coding and arrows help to visualize things:
Color Coding
- Green – Awesome (or damn near!); doesn’t necessarily mean things are perfect. It just means the team is happy with this area, and see no major need for improvement right now.
- Yellow – There are some important problems that need addressing, but it’s not a disaster.
- Red – This is really crappy and needs to be improved.
Trends
- Up arrow – Things are getting better over time
- Down arrow – Things are getting worse over time
- No arrow – Things are pretty much stable
Areas of Inquiry
The areas of inquiry are chosen to cover a wide range of different perspectives. Following are my suggestions, based off of the Spotify’s model, along with benchmarks for ratings:
|
Area of Inquiry
|
Example of Awesome (Green)
|
Example of Crappy (Red)
|
|---|---|---|
| Easy to Release | Releasing is simple, safe, painless & mostly automated. | Releasing is risky, painful, lots of manual work, and takes forever. |
| Suitable Process | Our way of working fits us perfectly | Our way of working sucks |
| Health of Codebase / Quality of Work | We’re proud of the quality of our work and with what we are producing! It is clean, easy to read, and has great test coverage. | Our code is a pile of dung, and technical debt is raging out of control. We are not meeting our own expectations. |
| Delivering Value | We deliver great stuff! We’re proud of it and our stakeholders are really happy. We have a good balance between working on “Capabilities” (Value for Stakeholders) and working on “Chores” (Value for Team) | We deliver crap. We feel ashamed to deliver it. Our stakeholders hate us. We never get to our chores. |
| Speed | We get stuff done really quickly. No waiting, no delays. We make at least 80% of our sprint commitments. | We never seem to get done with anything. We keep getting stuck or interrupted. Stories keep getting stuck on dependencies. We make our sprint commitments less than 25% of the time. |
| Mission | We know exactly why we are here, and we are really excited about it. The territory we cover is “just right” for our team size and mix of capabilities. | We have no idea why we are here, there is no high-level picture or focus. Our so-called mission is completely unclear and uninspiring. The ground we are required to cover is way too large. |
| Fun | We love going to work and have great fun working together | Boooooooring. |
| Learning | We’re learning lots of interesting stuff all the time! | We never have time to learn anything. |
| Support | We always get great support & help when we ask for it! | We keep getting stuck because we can’t get the support & help that we ask for. |
| Pawns or Players | We are in control of our destiny! We decide what to build and how to build it. | We are just pawns in a game of chess, with no influence over what we build or how we build it. |
| Teamwork | We are a totally gelled super-team with awesome collaboration | We are a bunch of individuals that neither know nor care about what the other people in the “team” are doing. |
Gallup Q12
The Gallup Group offers a Fortune 500 Employee Engagement Tool:
Q12: Gallup Employee Engagement Center, for small-to-medium sized businesses, is your solution to measure what matters, strengthen your workplace, and boost your bottom line by accessing the same powerful engagement tools used by leading Fortune 500 companies, from $15 per employee.
The Q12 is a baker’s dozen:
- How satisfied are you with your company as a place to work?
- I know what is expected of me at work.
- I have the materials and equipment I need to do my work right.
- At work, I have the opportunity to do what I do best every day.
- In the last seven days, I have received recognition or praise for doing good work.
- My supervisor, or someone at work, seems to care about me as a person.
- There is someone at work who encourages my development.
- At work, my opinions seem to count.
- The mission or purpose of my company makes me feel my job is important.
- My team members are committed to doing quality work.
- I have a best friend at work.
- In the last six months, someone at work has talked to me about my progress.
- This last year, I have had opportunities at work to learn and grow.
Mood App – RIP 🙁
MoodApp was designed and built by Atlassian to capture their teams’ feedback. It allowed employees to provide feedback daily and gave the company the opportunity to respond and adapt immediately if there was a problem brewing. Unfortunately, it has been retired… If you go down the MoodApp route, you could set up your own survey with perhaps the following five questions:
- How fun was this week?
- How satisfied are you with *your* performance this week?
- How do you rate your team’s ability, collaboration and joint efforts this week?
- Did we do adequate planning in advance of our work this week?
- How was your ability to focus this week?
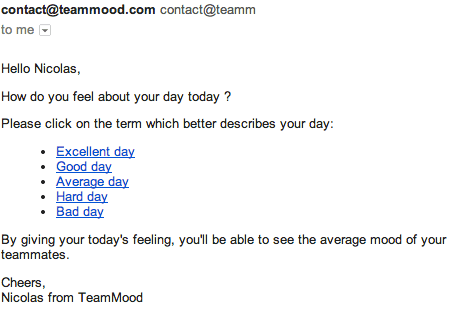
TeamMood
TeamMood.com – is a nice, simple, straightforward tool that provides daily email/slack prompts and a most excellent analytics dashboard for Agile Team Health Checks!
eNPS
Net Promoter Scores are typically used at the organizational level to assess the effectiveness of operations or strategies. But the approach could easily be adapted to teams:
- Survey your teams as well as organizational leadership on issues such as trust, ownership, and dealing with ambiguity.
Comparative Agility Survey
Comparative Agility™ is an assessment tool created by Mike Cohn of Mountain Goat Software and Kenny Rubin of Innolution to help teams compare their use of Agile against others and help determine actionable next steps in their own agile improvement efforts. It’s free. Not directly a happiness metric… but I suspect there’s a nice correlation between agility and morale…
Nöjd Crispare Index – The Crisp Happiness Index
Open-source approach https://dna.crisp.se/docs/happiness-index.html with 3 main questions in the survey:
- How happy are you with being at Crisp? This is the main overarching happiness index.
- How happy are you with your tasks in Crisp? This means internal work such as board meetings, conference facilitation, or creating this Crisp DNA site. This is especially relevant for our office team, who do most internal work and have no external clients of their own.
- How happy are you with your current client or your bench situation? We measure this separately, because sometimes a person could be really happy with Crisp, but sad about the current client. Or vice versa. For people who are on the bench (= no client at the moment), this can express how they feel about that (sometimes people WANT to be on the bench).
The scale is:
- 5 = Super-happy! Don’t want to change anything!
- 4 = Pretty happy, but there are some things that need to be fixed.
- 3 = I can live with this, but there are many things that need to be fixed.
- 2 = Not feeling so good about this right now.
- 1 = This is crap! I want out.

Team Barometer – Jimmy Janlén
“The barometer is executed as a survey in a workshop. The survey consists of 16 team characteristics, packaged as a deck of cards. Team members vote green, yellow or red for each card in the meeting (or before the meeting as an anonymous survey). Once all cards have been run through, the team reflects and discusses the results.” Takes 30-50 minutes to gather Agile Team Health Check insights. Click here to download the cards. (Full overview w variations)
Team Morale Metric
The Team Morale metric is a modified version of the UWES by Wilmar Schaufeli and Arnold Bakker, a psychometrically validated and reliable metric to assess work and well-being.
TeamMetrics was created and shared by Christiaan Verwijs as a “hobby project.” (Thanks Christiaan!) It is a simple, free survey tool to help Agile teams improve by gathering objective data about key team factors such as team morale and interpret the results with the help of benchmarks. Christiaan also has a great post on “health” vs. “morale” – Agile Teams: Don’t use happiness metrics, measure Team Morale – a nuanced and meaningful distinction…
Lean Agile Intelligence
Similar in vein to Mike Cohn’s Comparative Agility approach is Lean Agile Intelligence – by Mike McCalla. LAI includes a customizable health check. They’ve got the Spotify Health Check model built-in. As well as a few others. One of those other models is Team Culture which focuses on behaviors, interactions, values, and motivations. That culture check is influenced by the Five Dysfunctions of a Team, Reinventing Organizations, and Management 3.0.
Happiness, Innovation, and Productivity (H.I.P.) Survey
I caught wind of this instrument via Sandy Mamoli and David Mole’s book: Creating Great Teams via Self Selection. There are a half-dozen questions, some coming from Daniel Pink’s Drive. While Pink’s approach is more focused on the individual, Sandy expands it to the team:
- Purpose: Are we doing meaningful work that comes to fruition?
- Creativity: Are you allowed to do what’s best for your work by focusing on one thing at a time?
- Autonomy: Do you have a direct influence on how you and your team works and solves problems?
- Relationships: Do you work on a team where people support and challenge each other?
- Mastery: Have you been able to learn new skills at work?
- Creativity: Can you be creative at work, through success and failure?
OfficeVibe
OfficeVibe is a paid tool., $4/per person per month. A ton of features. Pulse surveys, employee feedback, engagement reports. It provides customizable questions and gathers insights via a prompt. Ability to have anonymous conversations, reply to feedback. Robust reporting with geographic and departmental insights. Integrates with Slack, Google, and more.
15Five
Another Swiss army knife: With weekly check-ins, continuous feedback, props, and kudos via High Fives, OKR’s, 1-1 note-taking, self-reviews and more. $7/pp/month for the basic, and a $14/pp/month plus version with all the bells and whistles.
7Geese
So much more than just a health check! 1-on-1 check-ins, 360/180 feedback, reviews, recognition, and OKR’s…
Agile Fluency Model
Diana Larsen and James Shore co-founded the Agile Fluency Project with the goal that every team should work at the level of fluency that best fits their business’ needs. (Fluency is a routine and deliberate practice that results in mastery that persists under stress.) The Agile Fluency Diagnostic provides a guided self-assessment that helps teams determine their position on the Agile Fluency pathway (“Where are we?”) and with the support of trained facilitators, they can chart a course towards continuous improvement (“Where do we want to head?”). Learn more about the methodology via this video.
Team Trust and Ownership
 Autonomy, mastery, and purpose ain’t nothing without sufficient levels of trust and ownership. And yes, you can measure those via a two-part survey.
See the assessment here: “How Filled with Trust is Your Organization?”
Team Culture
It is possible to also measure the culture of organizations – at the team level. Here’s a survey from Nicole Forsgren’s book Accelerate, that’s based on the ‘Westrum continuum’ – a survey you could gather data from quarterly, all decent directional indicators of team health and happiness:

Echometer Agile Team Health Checks
 Echometer is a software tool that combines Agility Health Checks and Retrospectives. Validated KPIs can be defined both at the management level (e.g., the Agile Center of Excellence) and individually at the team level (e.g., Scrum Master), which are regularly measured in small pulse surveys – and can be integrated into retrospectives in an interactive and varied way with the help of Echometer. More at: https://echometerapp.com/en/
Who Team Health, Happiness, and Employee Engagement Metrics Are For
There are two stakeholders for this model:
- The team itself. While discussing the different indicators (red/yellow/green, improving, de
 teriorating, stable), the team gets the chance to build up awareness and discuss what’s working and what’s not. The right (and broad) selection of questions will help expand their perspective without being exhausting. (Perhaps they were focusing on code quality issues, but hadn’t really thought about the customer value perspective, or how fast they learn.) This visualization model also provides a balanced perspective, showing the good stuff as well as the pain points.
 - People supporting the team. Sponsors, Product Owners, Managers, and Coaches that work outside (or partly outside) the team will get a high-level summary of what’s working and what’s not. This stakeholder group can also see patterns across multiple teams, e.g, by looking across rows, or by noticing how many arrows are pointing up vs down.
What Agile Team Health and Happiness Checks Are Not
- An agile team health check model is not a competition nor a comparison across teams. If team A is mostly green and team B is mostly red, that doesn’t mean team A is “better”. It could just as well mean that team A has a simpler context or a more optimistic outlook, or that team B is more honest about their struggles. Either way, the model and visualization tool is about support and improvement, not judgment. The organization’s attitude should be “how can we help?” and not “why are you guys worse than the others?”
- This is not an incentivized model – there’s no reason for a team to want to game thing just to “look good.” Our teams intrinsically want to succeed and will perform as well as they can under given circumstances. This model is meant solely as a tool to help boost and focus team improvement efforts, for the sake of improvement alone.
- “Done.” Like everything we do, inspect and adapt. If this model helps teams, keep doing it. If there are ways to make the model more useful, try them. If a team finds no value in this, stop it.
Again, as George Box said, “all models are wrong, but some are useful.”
Technical Health Metrics
There are many other lenses to look through to get a glimpse of “how the team is doing.”
For ideas related to process, release, product, and technical / code metrics see: Understanding Agile Team Metrics
Managing for Happiness Resilience
 I have experimented with almost all of the above on various teams over the years. Will any of them work for your Agile Team Health Checks? I honestly can’t tell you. But what I can tell you is that it is worth trying something. Don’t aim for happiness. It’s a delusion. Don’t chase a mood.
Instead, by making visible what’s going on – in near real-time – you can react to help teams build a strong constitution. And then as leaders, coaches, and managers, you can help teams handle adversity, with resilience and grit. Nurturing healthy environments that enable people to work through the tough problems that come with the complex (and chaotic) domains we travel daily. Create the conditions for a culture rich with collaboration and innovation.
I hope these ideas will help with your inquiry into what makes a difference – by gathering data and visualizing metrics… so you can learn from them. While it is not always about happiness directly, I think you’ll find it’s a likely by-product…
More on Agile Team Engagement, Health and Happiness
- Managing for Happiness: Games, Tools, and Practices to Motivate Any Team
- Creating Great Teams: How Self-Selection Lets People Excel
- Joy, Inc.: How We Built a Workplace People Love
- 3 Simple Productivity Metrics for Agile or Waterfall
- Happiness Metric – The Wave of the Future
- The 12 Steps to Worker Happiness, and beyond!
- 12 Steps to Happiness (Poster)
- The Ultimate Employee Engagement Guide (blog post)
Hi Andy, thanks for this round up, I’ve found it useful on more than one occasion. Just wanted to let you know that the Comparative Agility tool is not free (or perhaps not anymore), it’s $500 per team.
Thanks for the info Katya!
TeamMetrics has shut down on May 31, 2023
If you’re looking for an alternative, you can try the Agile/Scrum Team Survey.
https://scrumteamsurvey.org/
Click “Diagnose Team (Free)” and select “Focus: Team Morale” as the questionnaire type. This allows you to measure team morale in your team with a similar set of questions. This platform gives more actionable feedback, is GDRP compliant, and is based on a broader scientific model for what makes teams effective.
More on happiness at work: https://www.whattheheckisarbejdsglaede.com/